Initial Results are in: Radical Public-Private Collaboration Demonstrating CNX Natural Gas Development Poses No Public Health Risks
August 14, 2024

by Hayley Scott, CNX Chief Risk Officer
Executive Summary
CNX Resources Corporation, through an agreement with Pennsylvania Governor Josh Shapiro and the state Department of Environmental Protection (PADEP), established its Radical TransparencyTM program to provide a source of factual information and recorded environmental data on the impact of natural gas operations in Pennsylvania. Such data is intended to provide the concrete, objective knowledge the public seeks regarding impacts on human health from the natural gas industry, and to inform future public policy decisions in the Commonwealth with accurate, real-time data collected by an independent, accredited third party, and made available simultaneously to CNX, PADEP, and the public.
The Problem
Unfounded accusations and innuendo drive current popular narratives regarding the potential health impacts of responsible natural gas development. The agendas of those ideologically or financially opposed to progress and development have pointed to ambiguous and suspect statistics to goal-seek to their desired conclusions. This results in policy lines being drawn based on speculation, emotion, fear, and ideology instead of objective facts and data. At CNX, we believe this business-as-usual state of play must change.
What We Have Measured and Reported
CNX has been monitoring emissions at production pads and midstream stations since November 2023 after the launch of its Radical TransparencyTM program. CNX began monitoring and providing transparent real-time data to all stakeholders on air quality, waste monitoring and water quality. As of August 1st, 2024, over 101,000 data measurements have been collected and reported to PADEP and posted on our Radical TransparencyTM website since the inception of the Radical TransparencyTM program. That tally grows by the hour, daily.
The attached report analyzes air monitoring data, subject to quality assurance and quality control protocols, for two of our continuously monitored unconventional gas well pads, comprised of data recording particulate matter measuring less than 2.5 microns in diameter (PM2.5) concentrations, and continuous recording of air samples for Benzene, Toluene, Ethylbenzene, and Xylene (or “BTEX compounds”). We have compared the PM2.5 results to data reported by the regional air quality monitoring network maintained by the PADEP and the Environmental Protection Agency’s National Ambient Air Quality Standards (NAAQS), and compared BTEX results to established health-based standards, such as Minimum Risk Levels (MRLs) for inhalation exposure, as appropriate.
The Results
The results demonstrate that emissions from CNX's responsible natural gas development fall well below science-based air quality standards that are designed to protect the public from negative health effects resulting from emission of PM2.5 (asthma) and BTEX (cancer). There have been no sustained levels of any significance of PM2.5 or BTEX at these sites during any phase of development.
- PM2.5 concentrations were (i) below NAAQS levels at all sites and (ii) well below levels observed within regional urban environments.
- Measured concentrations of BTEX are well below minimum risk levels at all sites.
While other studies have used loose statistical associations based on data collected miles from gas operating sites, CNX’s Radical TransparencyTM program collects on-site data (500’ perimeter to the well bore), which is the most concentrated reading available as emissions decrease with distance due to dispersion.
Path Forward on Radical Transparency
These objective, measured data cast doubt and raise concern about the validity of the University of Pittsburgh (Pitt) study that was released in August 2023 that purported to link natural gas development to negative public health outcomes in southwestern Pennsylvania.
Further, these results and the consequential doubts they raise with respect to the Pitt study should raise concerns among the local medical and environmental community as to the actual cause of exacerbated asthma and childhood cancers reported in the study area that some previously wrongly attributed to the natural gas industry. The observed results indicate that if Pennsylvania citizens are becoming sick at higher rates than elsewhere, then we must look elsewhere to understand the causation and remedy. If it is the health of Pennsylvanians that such groups advocate for and not merely opposition to the natural gas industry, it is time for the medical and environmental organizations who focus on these matters to step up and work toward a real solution.
Conclusion
As demonstrated by the data in the attached report, CNX's natural gas operations do not emit levels of emissions that cross well-established human health thresholds set by the EPA. Indeed, the data in the attached report demonstrate that emissions from natural gas development and production are consistent with ambient readings, are better than NAAQS standards, and are significantly lower than those observed in urban environments.
CNX will continue to monitor its operating sites and expand the number of well pads and midstream stations as its operations progress. As of this writing, CNX is reporting air quality monitoring at 11 active unconventional gas well pads and two compressor stations, a number which will grow until the Radical TransparencyTM program covers all unconventional CNX operations. CNX also intends to supplement the scope of data that we are collecting and transparently sharing as the program matures, in addition to the measurements we are currently collecting and publishing which includes PM2.5, BTEX, chemical additives, water quality, radiation, and methane leak detection information. All our observations and analysis to date lead us to expect that the data will support and reinforce the conclusions reported here – that CNX responsible natural gas development operations are not a threat to human health. In addition, CNX is also collaborating with PA DEP to provide it with unprecedented access to two future, to-be-constructed CNX well sites, allowing for in-depth independent monitoring of the air emissions at both locations before, during, and after the development of the new wells.
This Radical TransparencyTM data is vitally important to community members, industry regulators, and healthcare providers. Pennsylvania policy should follow the measured data, which indicates that there is no need for additional setbacks or other restrictions that go beyond what is already one of the most robust regulatory regimes in the entire nation.
Any future studies by any entity or organization should now reference actual data – not loose statistics molded to infer vague associations.
We’re proud that our collaboration with Governor Shapiro is helping to ensure that facts, data, and impartiality inform public policy decisions in the Commonwealth. Radical TransparencyTM has and will continue to benefit all stakeholders, most importantly residents and the environment in which we all live. We are committed to expanding this program across the Commonwealth and across the industry to ensure that the vast benefits of the natural gas industry can continue to be realized by all stakeholders across Pennsylvania and beyond.
Radical TransparencyTM Air Monitoring Results

Background
Grand Jury Report
A Grand Jury investigation into the natural gas industry in 2020 found evidence that some natural gas companies were operating in a manner that endangered public health and safety after they heard testimony from Pennsylvanians who believed that their health issues were a result of fracking happening near their homes. These citizens and their doctors did not have the concrete data to enable them to determine what was making them and/or their children sick. The Grand Jury laid out several recommendations, including finding the appropriate distance between wells and homes, schools, and hospitals and requiring disclosure of all chemicals used in the drilling process.
The report reinforced that the public has real questions about the natural gas industry and that we need to provide more facts and more data so that we can all ensure that we have the appropriate protections in place. In response, the state provided funding to commission a study on the health impacts of natural gas development.
Pitt Study
In August 2023, the University of Pittsburgh (Pitt) released the results of its studies on the public health impacts of natural gas development in southwestern Pennsylvania. The studies left much to be desired and suffered from fatal design flaws.
The studies failed to find a causation that would link natural gas development to health problems. The findings found very weak associations of natural gas development on two discrete health issues.
In statistics, it is important to differentiate between ‘association’ and ‘causation.’ Two variables may be associated without a causal relationship. For example, there is a classic example of correlation where both ice cream sales and shark attacks peak in the summer; however, we can all discern that ice cream consumption does not cause shark attacks, nor do shark attacks lead to increased ice cream sales.
Causation means that the exposure produces the effect. The real cause of both ice cream sales and shark attacks peaking in the summer is the warm weather, which drives more people to buy ice cream to cool down and/or head to the beach to swim.
The Pitt studies found no causation from unconventional shale development to any of the health risks studied. Rather, researchers stretched to find two associations using skewed measurements, atypical definitions, and not attempting to account for key environmental and other factors that have proven demonstrable impacts on health.
The studies relied on a very limited proximity metric, which doesn’t identify any exposure pathways, assumes constant emissions, and ignores critical factors like weather, work, air dispersion, lifestyle choices, and known existing hazards. In addition, the studies assumed all natural gas wells “are created equal.”
Indeed, the researchers acknowledged, “No evidence was found to support an association between exposures to [natural gas] activities and other environmental factors and the risk of leukemia, [central nervous system] tumors, and malignant bone tumors, including [Ewing’s Family of Tumors].” An extremely low lymphoma association correlation was found, underscoring the limited methodologies employed.
Asthma exacerbations were not linked with proximity to wells in pad preparation, drilling, or hydraulic fracturing phases, regardless of how close wells were to homes or the number of wells nearby. Curiously, the only association claimed was to the natural gas “production” phase, after a gas well is turned in line and starts flowing natural gas, when little to no activity occurs on the pad, and emissions are minimal.
Ironically, Pitt’s own data on asthma in western Pennsylvania show a 50% decline in severe asthma cases between 2014 and 2020, even as natural gas production in the study region increased by over 200%. Across the study period, air quality in the Western Pennsylvania region has generally improved, with PM2.5 particulate matter, an asthma trigger, declining in the eight-county study area to well below NAAQS (EPA). Reviewing the Asthma and Allergy Foundation of America’s “Most Challenging Places to Live with Asthma” informs that no region (including Pittsburgh) with natural gas development falls in the top 20, but Philadelphia, Allentown, and Harrisburg each do.
The Pitt study found child birthweights where mothers live close to natural gas facilities remain in the normal healthy range and have no association with other adverse birth outcomes. The average birthweight was within the national average of 2400-4000 grams, and the greatest reduction in birthweight associated with natural gas well exposure was only 0.8% below the average, still well within healthy ranges. The researchers pointed out this “poses little health risks.” Interestingly, the odds of preterm birth were higher for those living with no natural gas activity near the mother’s residence during pregnancy.
Fatal Flaws of the Pitt Studies
The Pitt studies suffer from fundamental limitations in design and methods that, coupled with how the findings were presented to the public, raised anxiety unwarranted by actual data.
Researchers never visited shale gas sites, refused opportunities to do so, didn’t take air or water samples, or generate any new, original data or measurements. Statistical speculation trumped actual measurement.
If the researchers had spent time in the field, they would have seen how natural gas development is safe, well-regulated, and produced here better than anywhere else in the world.
In addition, the researchers relied solely upon statistical models and static locational information. They ignored key influential factors like actual emissions, wind, air dispersion, and weather patterns, not to mention other potential environmental sources of exposure or outdoor hazards.
In a Question-and-Answer document regarding the research studies, the Pennsylvania DOH cautioned: “Establishing cause-effect relationship in environmental studies is very difficult. In many cases, it is also not generally feasible to be able to gather information on or understand all the possible factors that may impact health, such as genetics, other exposures over a lifetime, and lifestyle factors that may impact the health outcome in question.”
Consider the finding of an association of natural gas development to lymphoma (0.006%-0.0084% association between diagnosis and well location) and no association with other cancers, including Ewing Sarcoma. The researchers primarily relied on the relation of the disease and how close sufferers lived to a fracking facility. Because data was limited to information found on birth certificates, the studies wrongfully assumed people lived at the same address for up to 29 years, while ignoring daily travel to locations like schools and workplaces. Such an approach would be laughable if it were not for the serious issues at hand.
The researchers admit the cancer study did not adequately account for variables the American Cancer Society lists as common lymphoma causes. These include genetic predisposition, infection, and exposure to radiation (such as the Canonsburg, Pennsylvania uranium waste facility where government monitoring has shown higher radiation levels).
The asthma assessment suffered from similar methodology flaws, failing to account for known asthma triggers including indoor and outdoor air pollutants, and refusing to present this data to the public. Nor did Pitt researchers explain why they labeled all asthma cases as “severe” when the standard in medical studies is to categorize asthma cases as mild, moderate, and severe. Without explanation, Pitt’s study breaks from medical research norms by labelling all levels of asthma as “severe”.
The asthma data were limited to information found in medical records. Meaning that while smoking status was accounted for, a child’s exposure to secondhand smoke was not. Other known asthma triggers that were ignored, as identified by the CDC, include indoor and outdoor air pollutants, dust mites, mold, and pests. This leaves a huge gap in the potential other external factors that are known to trigger and exacerbate asthma.
Path Forward
CNX determined that a sensible path forward existed that would remove the emotion, guesswork, speculation, and innuendo of these flawed studies and replace them with certainty, transparency, measured data, and real-time monitoring. With the launch of CNX’s Radical TransparencyTM program in November 2023, we began pushing the regulatory state of the art by measuring and reporting data to provide the solid, objective knowledge the public seeks and to inform policymakers with accurate real data when setting policy and standards.
The specific components of the Radical TransparencyTM program can be categorized in the arenas of Air Quality, Water Monitoring, Chemicals, and Waste.
In the arena of Air Quality:
- For any unconventional gas wells or compressor stations, continuous monitoring of PM2.5 concentrations and continuous collection of air samples for VOC analysis for characterizing long-term average concentrations during all phases of well pad development and well production, including six months of monitoring during the production phase.
- Data collected is being shared publicly in real time on our company website at CNX Radical TransparencyTM
- All data is collected by and reviewed for quality assurance by a qualified third party, Clean Air Engineering, whose activities are governed by their Ambient Monitoring Quality Management Plan (QMP), which details their quality control program for ambient air quality monitoring services. The QMP was audited by the United States Environmental Protection Agency (EPA) in 2017, and the company was approved for the operation of State and Local Air Monitoring Stations (SLAMS) as a Primary Quality Assurance Organization. All data is provided unabridged directly to the Pennsylvania Department of Environmental Protection (DEP) and to CNX Resources.
In the arena of Water Monitoring:
- Expanded pre-drill water survey for private residential drinking water supplies (wells and springs) to within 2,500 ft of a vertical unconventional well bore, centralized large volume storage tank battery, or centralized impoundment.
- The pre-drill survey includes at least four samples taken seasonally/quarterly ahead of drilling activity to obtain a more comprehensive understanding of groundwater quality ahead of natural gas activity. While private well/spring owners are not required to participate in this groundwater survey, those who do will be provided with copies of all analyses within 10 days of the receipt of the results by the operator and may elect to include their results anonymously in a broader public database.
- After well turn-in-line, at least four samples taken seasonally/quarterly are collected on private wells/springs to compare to pre-drill conditions, with the same election options for including in a broader public database.
- In addition to the pre- and post-drill samples, operators collect similar pre- and post-drill seasonal upgradient and downgradient samples of the nearest streams receiving surface run-off.
In the arena of Chemicals:
- Disclosure to the public of chemicals anticipated to be utilized during drilling and fracking ahead of operations, including chemicals used in mixtures protected as trade secrets.
In the arena of Waste:
- Publish Comprehensive Radiation Protection Plans and the results of the program’s annual self-assessment including any unanticipated action items resulting from findings. Provide transparent reporting of test results.
Air Quality Study
Air quality monitoring was initiated in November 2023 on a new production pad, NV110, located in Washington County, Pennsylvania. The program has since expanded to other production pads, in various phases of development (construction, drilling, completions, and production) and midstream stations. The monitoring includes continuous measurement of PM2.5 and BTEX compounds by a qualified third party, Clean Air Engineering.
PM2.5
Produced from the combustion of diesel fuel, smoke from fires, fossil fuels, and various everyday sources such as unpaved roadways and farm fields, PM2.5 is a fine particulate matter with an average diameter of 2.5 micrometers (μm). Clean Air Engineering has installed and is maintaining instrumentation to perform measurements following the Federal Reference Methodology established by the EPA. Two air quality monitors have been installed, one upwind and another downwind of each monitoring site. Hourly and average daily PM2.5 concentration data are reported and compared to the same period data reported by the regional air quality monitoring network maintained by the PADEP and PM2.5 NAAQS. Clean Air Engineering makes the collected data available to both the PADEP and CNX through their secure, cloud-based data server, and CNX displays the data in real time on its Radical Transparency website.
Meteorological data
Each site includes an integrated meteorological measurement system to record wind speed and wind direction, via a compact sonic anemometer. Wind and other meteorological data are recorded on a local data logger and transmitted to Clean Air Engineering’s secure environmental data management platform for easy access and visualization.
VOCs - BTEX
Natural gas may contain low levels of various volatile organic compounds (VOC), including some listed on the EPA’s list of Air Toxics. Chief among these, given its increased risk factor and prevalence, is benzene, which is present in all biogenic fuels, even firewood. To determine the impact of natural gas operations on VOC levels, Clean Air Engineering incorporated sampling via EPA Reference Method 325, which has been established to measure VOC in air by exposing sample tubes to air for a period of 14 days. The samples are analyzed for BTEX compounds, which are absorbed by the material within the sampling tube. Results are compared to established health-based standards of Minimum Risk Levels (MRLs) for inhalation exposure.
Study Design
For this project, there are two monitoring station locations for the measurement of PM2.5 for each project site, one in the direction of the prevailing winds (BAM-2, downwind location) and one in the direction the prevailing winds are coming from (BAM-1, upwind location).
Additionally, four passive samplers are installed to sample for BTEX at each site. BTEX samplers are located within a separate quadrant around each site. The quadrant selection is guided by seasonal prevailing winds with one quadrant representing approximate upwind and another the approximate downwind conditions at each site. These monitors and samplers are complemented by one meteorological measurement system per site.
Sampling and Monitoring Site Selection
Site selection of this monitoring program follows EPA sighting guidelines to the best extent practical. Monitor/sampler and meteorological measurement system locations are finalized during a site visit before monitor/sampler installation and onsite commissioning.
Considerations made when selecting an appropriate siting location for each monitor include:
- Prevailing wind direction,
- Property boundaries,
- Topography,
- Local obstructions,
- Distance to emission sources, and
- Operations.
Monitoring Site Description
Continuous PM2.5 concentration measurement site selection is guided by the prevailing wind direction such that a monitor located on the general upwind side of the site will collect background sample results, on average, and the downwind monitor will provide indications of any PM2.5 increase that can be attributed to emissions from sources at the site. As such, the PM2.5 monitors have been set 500 feet from the wellheads, where space allows.
A 10-meter-tall aluminum tower is installed at a third location (Meteorological Station) to support meteorological sensors.
BTEX passive samplers are located at four sites around the fenceline of each site with one sampler collocated with each PM2.5 monitor. The inlets of each continuous PM2.5 monitor and BTEX sampler are installed within the breathing zone.
Monitoring Equipment
PM2.5
The Met One Instruments Model BAM-1022 Continuous PM2.5 Monitoring System was selected for this project. The BAM-1022 uses beta ray attenuation to accurately measure and report the concentration of airborne particulate matter in ambient air by drawing air through a size-selective inlet and depositing the particulate on a filter tape that is located between the beta source and a detector. The degree of beta-ray attenuation is used to determine the mass of particulate matter deposited on the filter tape. The BAM-1022 calculates ambient PM2.5 concentrations based on the sampling flow rate and the PM2.5 mass deposited on the filter tape. The BAM-1022 is designated a Class III Federal Equivalent Method (FEM) when configured for 1-hour average measurements of PM2.5 using a glass fiber filter tape roll and a precisely controlled sample flow rate of 16.67 lpm.
The measurement cycle of the BAM-1022 is approximately one hour with a gap of one minute between measurements; however, given that the measurement occurs continuously while the PM2.5 mass accumulates on the filter tape, hourly results can be supplemented with shorter-term data that can be used for data trending purposes. For this project, the short-term concentration data period is set to 60 minutes, i.e., the instrument reports a 1-hour rolling average that is updated every five minutes starting at the end of the first sampling hour and until the sample is stopped.
EPA Method 325A/B Passive Sorbent Trap Sampler
The BTEX samplers consist of a sorbent trap that is suspended within a plastic cap to provide cover from the elements. The sorbent trap is designed to maintain a constant uptake rate for the target compounds via the use of a diffusion cap attached to each sorbent trap for the 14-day sampling duration. Each sorbent trap is suspended from a tripod to collect ambient air at the approximate breathing height of 2 meters.
Meteorological Measurement System
Each site is equipped with a sonic anemometer (wind speed and wind direction) that is mounted atop a 10-meter-tall aluminum tower of either telescoping round, tapering-tube, or open-frame design. The tower base is firmly secured to the ground.
A weatherproof AutoMet data logger designed to accept a variety of standard Met One Instruments and other sensors records direct measurements of wind speed and wind direction.
Monitoring Sites
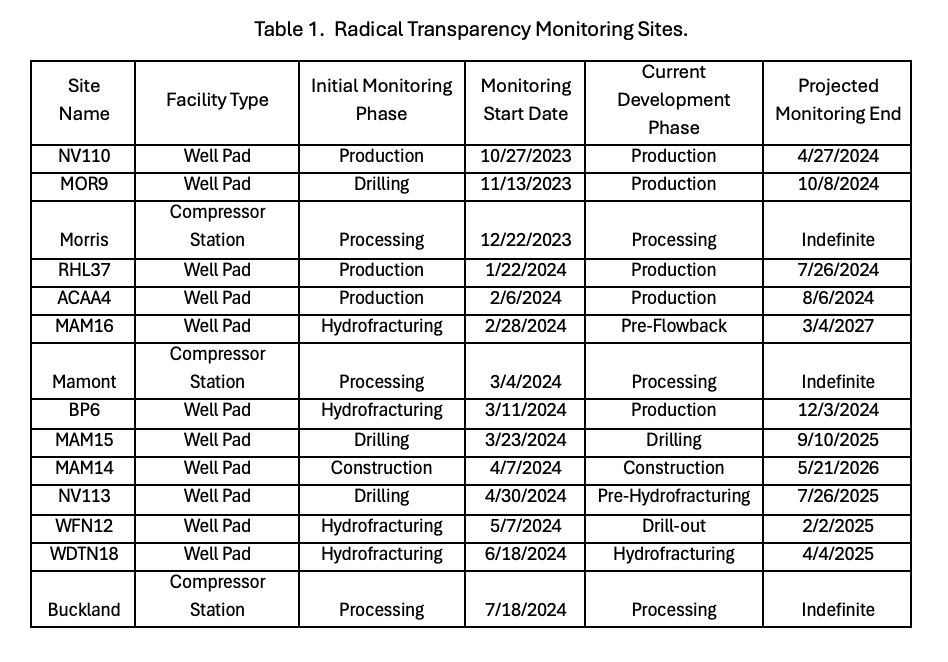
Since the initial November 2023 installation at the NV110 well pad, CNX has installed monitoring equipment on ten additional well pads, as outlined in Table 1. Well pad installations are added when a previously unmonitored location initiates a new phase of development. For example, a well pad with newly drilled wells will undergo monitoring installation immediately before the start of hydrofracturing, or a newly constructed well pad will receive a monitoring equipment installation before drilling is initiated on the pad. From the date of installation, monitoring has or will continue to include all following development stages and extend through at least six months of production.
CNX is also installing monitoring equipment on midstream facilities. To date, two compressor stations are outfitted with monitoring equipment. Additional midstream facilities are being outfitted for monitoring through the summer of 2024. CNX plans to maintain the monitoring equipment on these locations, indefinitely.
Results
To date, the NV110 site has completed monitoring with six months ending on April 27, 2024. The second site added to the project, the MOR9 well pad, received its installation at the start of horizontal drilling activities, continued through the completion stages, and is nearing the end of six months of production monitoring. In this section, we will present the sampling data and summarize results from these initial project sites.
NV110
Monitoring at NV110 was conducted while the well pad was producing natural gas at an average rate of 112,025 thousand standard cubic feet per day (mscfd). The well pad also produced condensate, initially at a rate of 82 barrels per day (bpd), before decreasing to no production, currently. Monitoring equipment is positioned as depicted in Figure 1.

Production equipment on the well pad includes:
- Seven Marcellus shale wells,
- Seven sand separator vessels with blowdowns,
- Seven natural gas-fired gas processing units,
- One high-pressure separator,
- One low-pressure separator,
- Two 400-barrel (bbl) condensate storage tanks,
- Three 400-bbl produced water storage tanks,
- One 400-bbl sand separator blowdown tank,
- Separate truck loading stations for condensate and produced water, and
- Four vapor destruction units, each rated at 12.8 million British thermal units per hour (mmBtu/hr) heat input, for vapor emission control from storage tanks and separators.
PM2.5
The two PM2.5 monitors were in operation for 97.8% of the sampling period. In contrast, EPA monitoring standards for compliance assessment require an availability of 75% data completeness and CNX’s QAPP limit of 80%.
The average hourly PM2.5 concentrations were 4.4 μg/m3 and 5.3 μg/m3 for BAM1 and BAM2, respectively. The concentrations were slightly above the monitors’ respective detection limits of 3.91 μg/m3 and 4.75 μg/m3. Figure 2 displays the hourly trends of concentrations for the two monitors. Throughout the sample period, CNX trended these data points against those from the PADEP Holbrook monitoring site, which is located 17.4 miles south-southeast of the BAM1 monitor. As seen in Figure 2, hourly BAM concentrations trended well with the Holbrook monitor and presented a few short-term occasions where the BAM concentrations exceeded those of the Holbrook monitor.

Figure 3 presents the distribution of hourly readings showing similar results between the NV110 readings and the PADEP Holbrook site.

The hourly measurements are used to generate daily 24-hour averages, which are compared to the NAAQS of 35 μg/m3. As shown in Figure 4, in all cases, data from NV110 remained below the daily NAAQS.

BTEX
BTEX results were compared to acute Minimal Risk Levels (MRLs) for inhalation exposure, which were developed jointly by the Agency for Toxic Substances and Disease Registry (ATSDR) and EPA to designate the relative level of exposure to a hazardous substance that is likely to be without appreciable risk of adverse non-cancer health effects over a specified duration of exposure. CNX conducted BTEX sampling for 14-day periods per sample, allowing us to compare our results against the acute impact levels. The MRLs are as follows in Table 2.
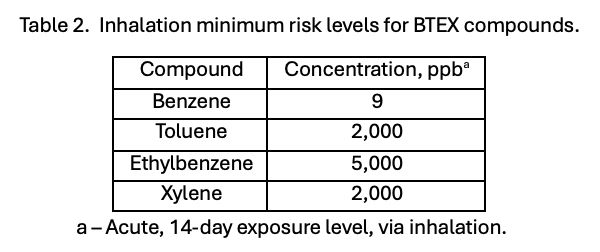
To increase the likelihood of collecting accurate samples, BTEX samplers were positioned at each BAM sampling site and in the two quadrants 90 degrees from the BAM sites so that four samples were collected simultaneously. Of the 14 and 14-day samples collected, no sample concentration approached the MRL, and only benzene was consistently reported at levels exceeding the analytical minimum reporting limit for the compounds (typically around 0.12 ppb). Figure 5 provides a chart that presents the results for each of the 14 samples.
By comparison, the measured benzene concentrations were not only well below the MRL but when compared to the recently published National Emissions Standards for Hazardous Air Pollutants (NESHAPS) for Coke Ovens, the benzene was below the action level of 0.9 ppb for coke oven facility fenceline monitoring.

MOR9
The MOR9 well pad was initially drilled in 2011 when four wells were turned inline. Two additional wells were drilled in 2014. In 2023, CNX returned to the well pad to drill four new wells. Monitoring was initiated with the horizontal drilling phase on November 13, 2023, and continued through the hydrofracturing, drill-out, and flowback stages of development. MOR9 is currently undergoing the six-month production period evaluation that started on April 8, 2024 and is slated to end on October 8, 2024.
The wells on this pad produce only natural gas from the Marcellus and Burket shale formations. The current natural gas production rate is 94,435 mscfd. Monitoring equipment is positioned as depicted in Figure 6.

Production equipment at this site includes:
- Eight Marcellus shale wells,
- Two Burket shale wells,
- Ten sand separator vessels with blowdowns,
- Ten natural gas-fired gas processing units,
- Four 400-bbl produced water storage tanks,
- One 400-bbl sand separator blowdown tank,
- One produced water truck loading station, and
- One vapor destruction unit rated at 12.8 million mmBtu/hr heat input, for storage tank vapor emission control.
PM2.5
The PM2.5 monitors have been operating for 96.6% of the sampling period, providing a data completeness rate that exceeded the EPA requirement of 75% availability and CNX’s QAPP limit of 80%. The average hourly PM2.5 concentrations, by development stage, are presented in Table 3.
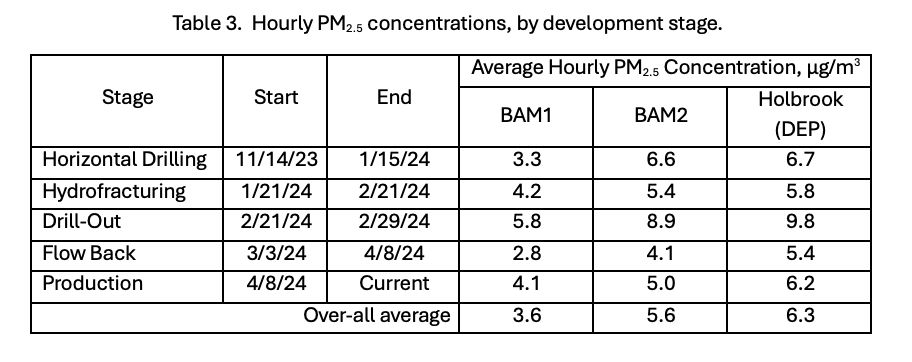
The BAM1 and BAM2 respective detection limits were determined to be 4.1 μg/m3 and 4.4 μg/m3. Figure 7 displays the hourly trends of concentrations for the two monitors. Throughout the sample period, CNX trended these data points against those from the PADEP Holbrook monitoring site that is located 12 miles south-southeast of the MOR9 Well Pad. MOR9 hourly BAM concentrations trended well with the Holbrook monitor and presented a few short-term occasions where the MOR9 concentrations exceeded those of the Holbrook monitor.

Figure 8 presents the distribution of MOR9 and Holbrook hourly readings showing MOR9 results, which are slightly lower, on average, than those from the PADEP Holbrook site.

The hourly measurements are used to generate daily 24-hour averages, which are compared to the NAAQS of 35 μg/m3. As shown in Figure 9, data from MOR9 remained below the daily NAAQS for the duration of sampling.

BTEX
As with NV110, CNX conducted BTEX sampling for 14-day periods per sample, allowing us to compare our results against the acute impact levels. Through May 31, 2024, 13, 14-day sample sets were collected, none were at a level that approached the MRLs, and only benzene was consistently reported at levels exceeding the analytical minimum reporting limit for the compounds, with an overall average of 0.19 ppb (MRL = 9 ppb; Coke Oven NESHAPS = 0.9 ppb). Figure 10 provides a chart that presents the results for each of the 13 samples.

Discussion
Through the course of this program, CNX has been observing the data with an eye toward potential impacts on the health of the environment, our communities, and our employees. The data from these first two sites are showing that, even within 500-feet of development activities and production of a natural gas well pad, the impacts are far below any published standards or levels of concern for fine particulate matter and BTEX compounds.
At both test sites, the data show PM2.5 results trending with those from the PADEP Holbrook regional PM2.5 monitor. Aside from a few operationally related spikes, the overall concentration of PM2.5 was lower than that measured for the same period at Holbrook.
The results from these well pads and the PADEP site serve to demonstrate the air quality in the rural areas these well pads are located. The results provided in Figures 4 and 9 provide evidence that unconventional natural gas well development and production contribute little to no fine particulate matter to the local air quality, as measured at these facilities, regardless of the activity occurring on the well pad.
Our region of operations includes the Pittsburgh metropolitan area, and the question begs, if well drilling and production period PM2.5 concentrations compare well with background measurements from the rurally located Holbrook site, how do concentrations compare to urban areas? To answer this, we compared these results, measurements taken 500 feet from sites having shale gas development and production activities to the measurements collected in the Pittsburgh neighborhood of Lawrenceville, which is the site of the Allegheny County Health Department (ACHD) Air Quality Program offices and serves as a monitoring site for PM2.5 and other pollutants. The site also includes HAP monitoring devices, which report data as an EPA National Air Toxic Trends Station (NATTS). The Lawrenceville Station is positioned near the geographic center of Allegheny County. It is 36 miles northeast of the NV110 well pad and only five city blocks from the Children’s Hospital of Pittsburgh.
In the most recent annual report from 2022, published in December 2023, the ACHD reported an annual PM2.5 concentration of 8.4 μg/m3 with a maximum 24-hour average of 21.8 μg/m3. The annual report does not include hourly readings; however, the hourly data can be retrieved from the ACHD website. CNX plotted the daily average data calculated from the hourly data against the daily average data from NV110 and MOR9 finding the short-term exposure rates at the Lawrenceville site were significantly higher in all but a few readings during the period of monitoring at the two well pads.
The PM2.5 results displayed in Figures 11 and 12 include comparisons for data starting with the initiation of monitoring at the NV110 site on October 27, 2023, and ending on May 31, 2024. Note that MOR9 monitoring was initiated on November 14, 2023, and the NV110 monitoring period ended on April 27, 2024. Overall, concentrations at the well sites are consistently lower than the urban Lawrenceville measurements.


BTEX readings from the well sites were also compared to results from the ACHD Lawrenceville site. As shown in the previous section, BTEX results from the well pads were trivial, with Benzene presenting the only results to exceed the minimum reporting limit. The results from ACHD Lawrenceville are markedly different. The urban setting with higher traffic volumes exposed its higher population to inhalable concentrations of benzene that were 10 to 30 times greater than those encountered near the well pads.
While the Lawrenceville numbers do not exceed the acute (14-day) MRL thresholds, the sources of these pollutants are present every day, and residents of urban communities have a greater tendency to spend more time in their neighborhoods. As such, the chronic (>364 days) exposure MRLs for BTEX compounds, outlined in Table 4 would be more suitable.

While we did not collect a full year of BTEX results at these sites, we can compare the BTEX results to the chronic exposure levels. In Figure 13, we can see that the well pad BTEX results are still far below the levels provided in Table 4.
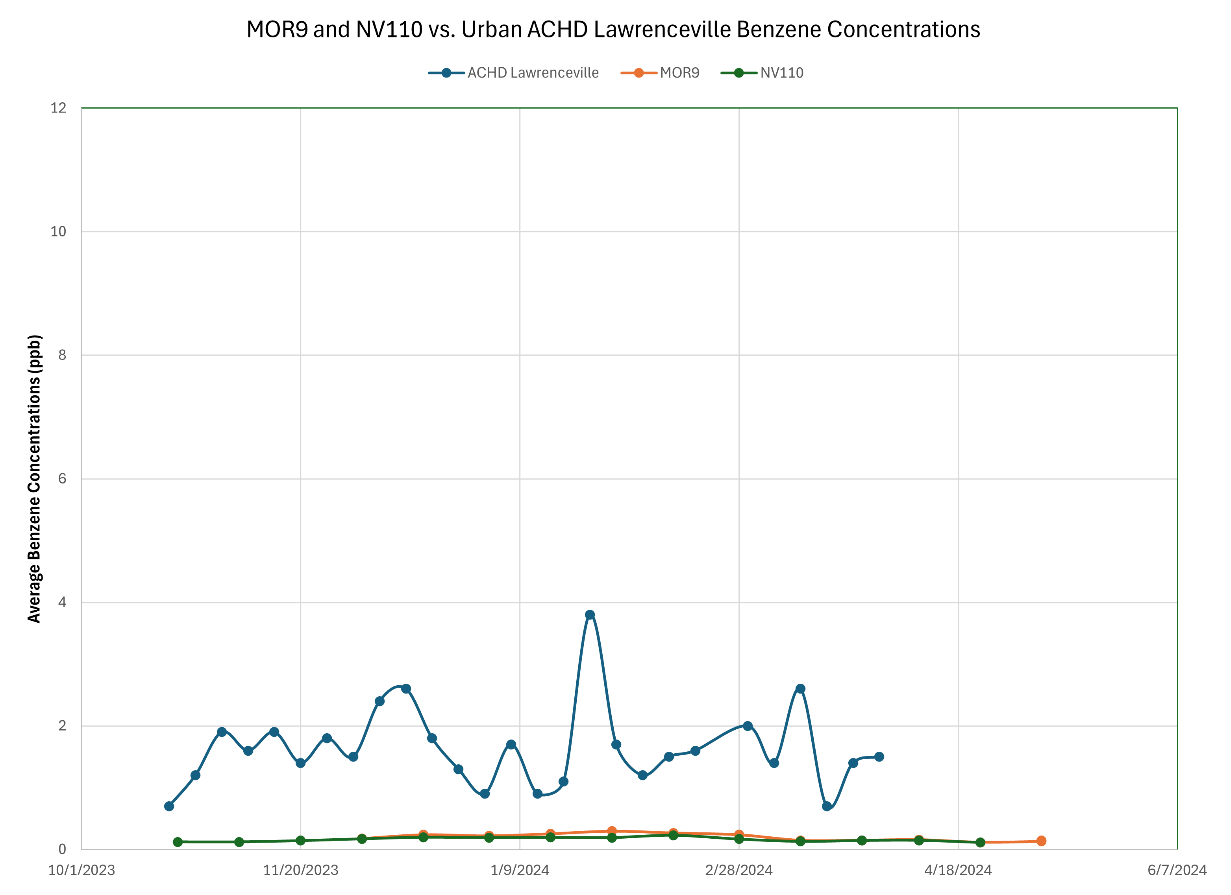
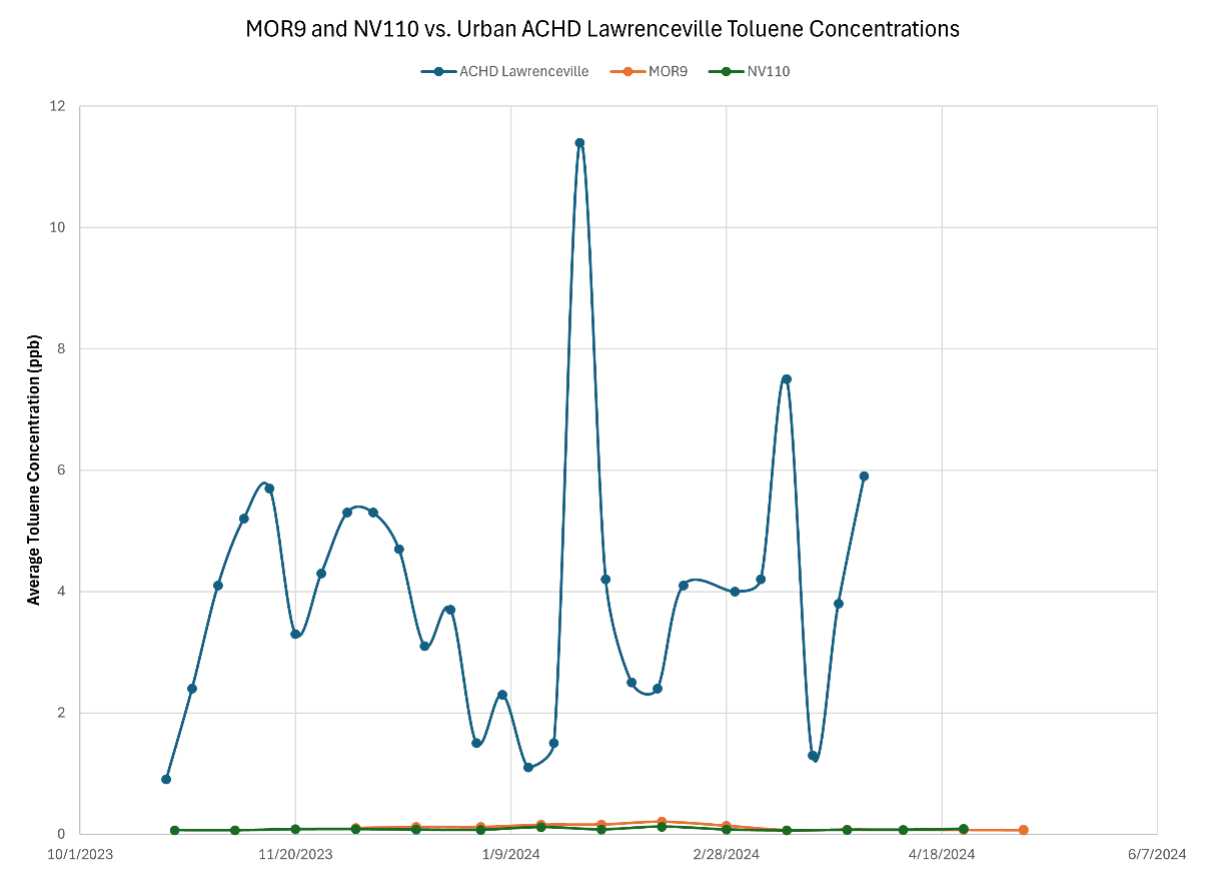
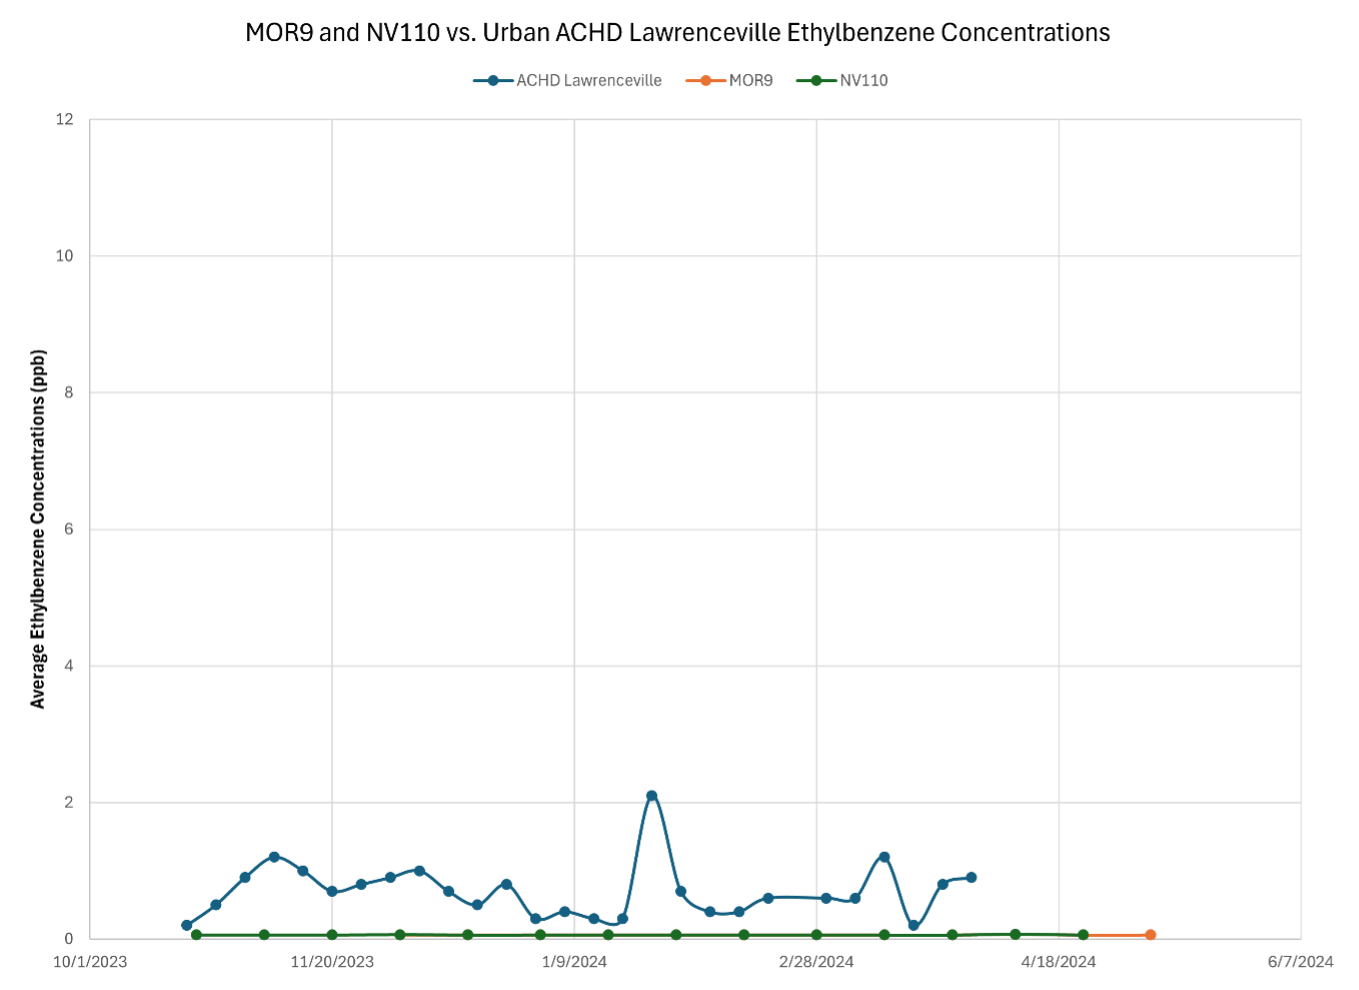
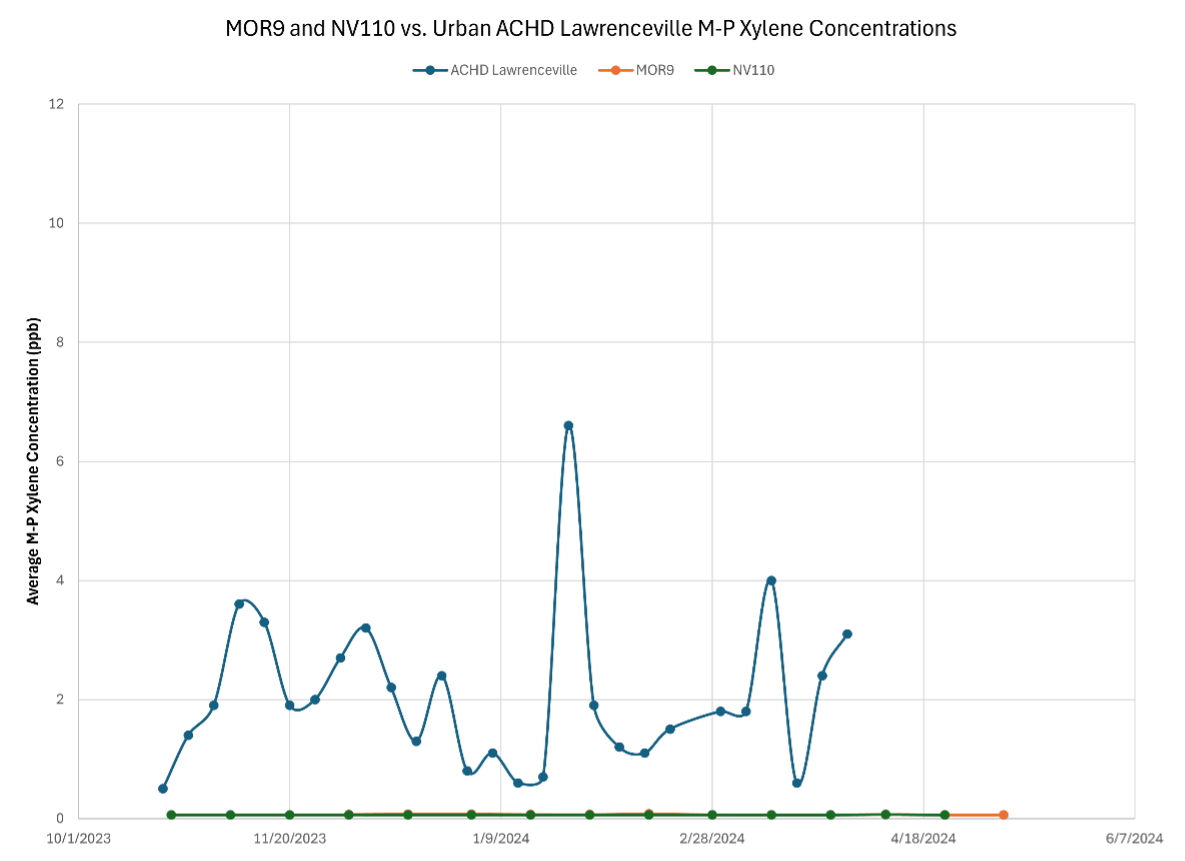
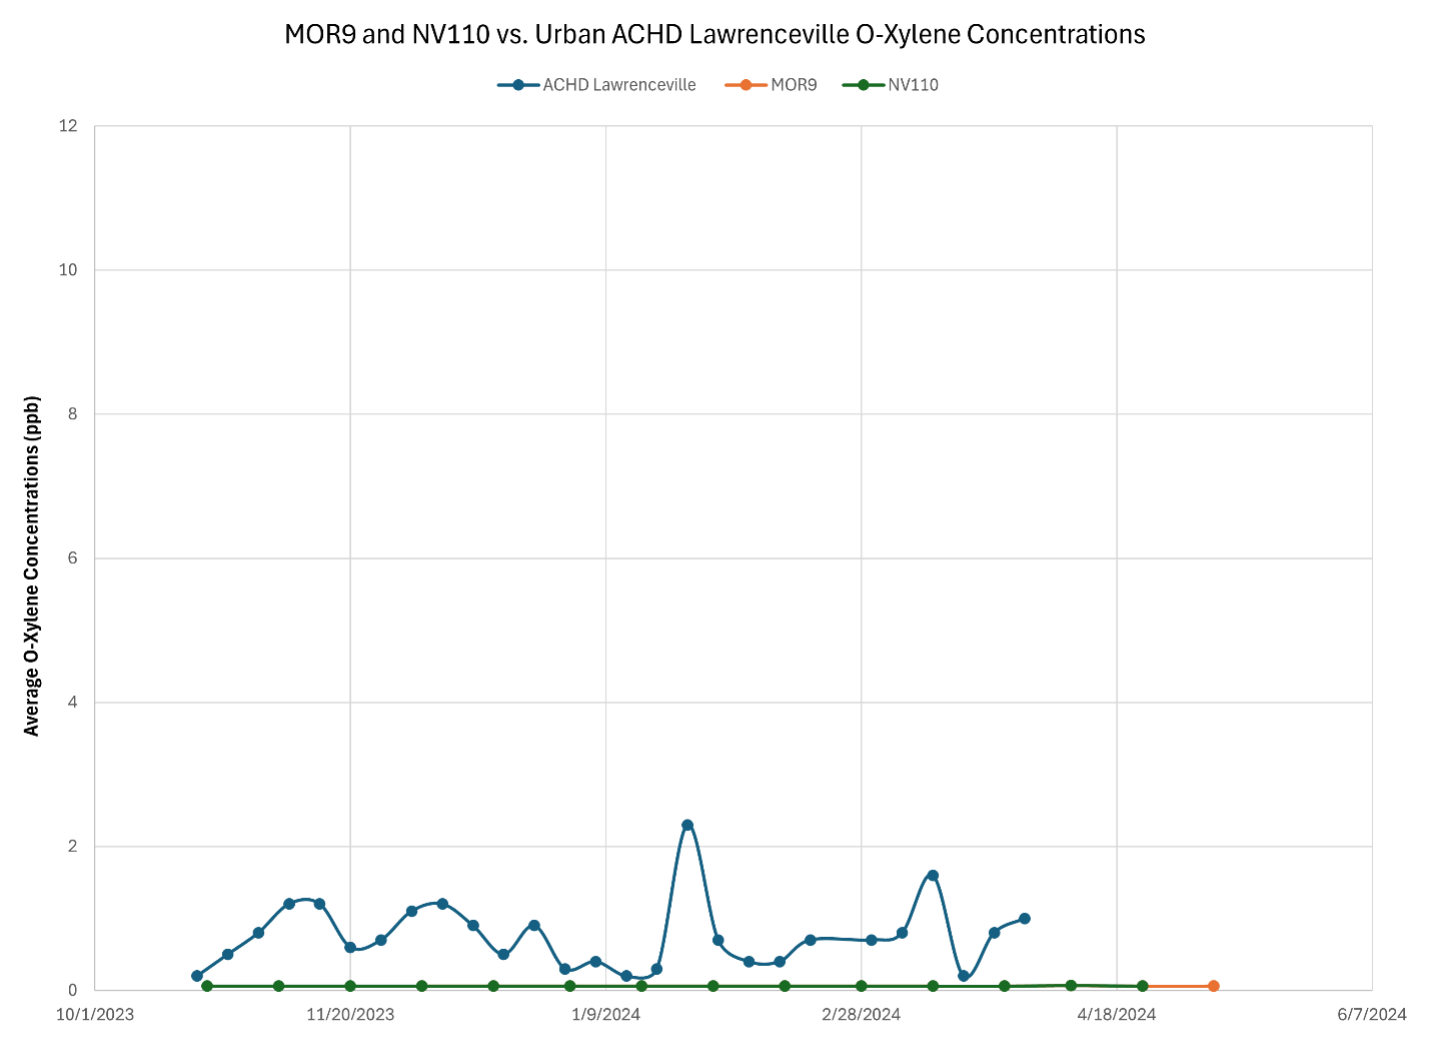
ACHD Lawrenceville results are closer to the MRL in all cases. Benzene maintains its concentration very near the limit of 3.0 ppb, even exceeding the MRL in one sample.
Conclusions/Summary
The results show that there have been no increases of any significance of PM2.5 or BTEX at these sites during any phase of development. There are no exceedances of the NAAQS or BTEX levels near the minimum risk levels at the sites (and emissions concentrations reduce with distance due to dispersion). There is no indication that air emissions from natural gas operations have an impact on human health in the over 101,000 data points that we have collected to date.
This data is of significant importance to community members, industry regulators, and healthcare providers. Pennsylvania policy should follow the measured data, which indicates that there is no need for additional setbacks or other restrictions that go beyond what is already one of the most robust regulatory regimes in the entire nation.
Any future studies by any entity or organization should now reference actual data – not loose data scrubbed to infer associations.
CNX will continue to monitor its operating sites and expand in the number of well pads and midstream stations (currently we report on 11 unconventional gas well pads and two compressor stations), as well as the scope of data that we are collecting and transparently sharing (we are currently providing PM2.5, BTEX, chemical additives, water quality, radiation, and methane leak detection information). This data continues to further reinforce the conclusions. We’re proud of our collaboration with Governor Shapiro to ensure that facts, data, and impartiality inform public policy decisions in the Commonwealth. Radical TransparencyTM has and will continue to benefit all stakeholders, most importantly residents and the environment. We are committed to expanding this program across the Commonwealth and across the industry to ensure that the vast benefits of the natural gas industry can continue to be realized by all stakeholders across Pennsylvania and beyond.
Related Articles


