Welcome to Radical Transparency Context Corner
A behind-the-scenes look providing relatable context to our valued community stakeholders regarding CNX’s Radical Transparency environmental monitoring and disclosure concept.
December 4, 2023

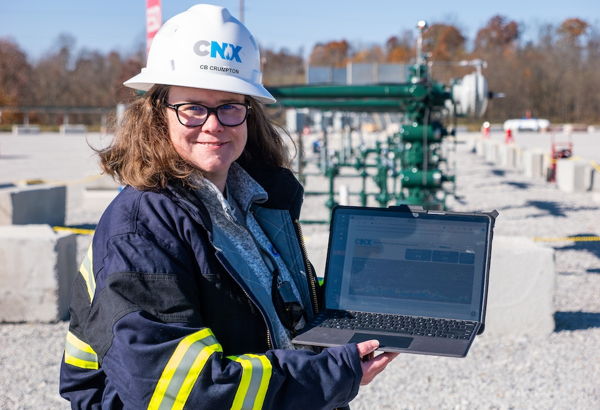
By Carrie Crumpton, CNX Vice President of Environmental Strategy
Thanks to all who have made our launch of Radical Transparency such a success! Since launch, we have been getting great feedback from internal and external stakeholders alike. We’ve also been getting some great questions that I’d like to make sure are addressed as we continue to improve on our transparent reporting.
From time to time, you’ll notice, we will see spikes or disruptions in our Air Quality data feed that you can see on the real-time charts on our Radical Transparency website. Our dedicated team in the Real-time Operations Center (RTOC) is doing a great job coordinating and communicating with the Operations field team to understand the conditions on and around our monitored locations. When we identify these unanticipated spikes or disruptions, we want to make sure we understand, log, and communicate our activity and other observations/conditions that could be contributing. You’ll see these points identified on our data feed with some of those observations and conditions noted. While we are transparently sharing this data to confirm for all stakeholders that there are no adverse human health issues related to responsible natural gas development, the collection of this data and conversion of it into valuable information will provide us with an understanding of potential areas for improvement. And continuous improvement is what CNX is all about.
Paired with the information you’ll find on the website data feed, I hope this narrative will serve as an additional source of information to help answer general questions, provide some context around what we are seeing in our data, and communicate improvement opportunities we’ve identified and implemented. This supplemental narrative isn’t intended to get too bogged down in technical aspects of the monitoring we are doing, but intended to help educate and provide some context around the numbers we are seeing.
Let’s start with questions I’ve received a few times as I’ve been talking and reviewing our data with folks over the last week:
Carrie, how can you have a negative PM2.5 number?
To answer this question let’s first talk a little about PM2.5. PM stands for particulate matter: the term that is used for solid particles and liquid droplets found in the air. This can include a variety of things, but most often particles like dust, dirt, soot, or smoke. PM2.5 defines these as fine particles measuring 2.5 micrometers or smaller. How small is 2.5 micrometers? Well, a human hair is about 70 micrometers in diameter – about 30 times larger than the size of the particles we are measuring on site; so to sum up in one word: TINY.
Next let’s talk a little about how we measure PM2.5. PM2.5 is measured with a PM2.5 monitor or aerosol sampler. These monitors work by drawing in air and then measuring the concentration of PM2.5 particles (measuring the mass collected) on a filter. Because the sampler runs for an hour and continuously captures these tiny particles (every five minutes), if wet particles get deposited on the filter surface, the instrument detects the mass of these wet particles. As those particles dry during the one-hour measurement period, the sample weighs less, so the number is lower. When the total concentration is very low (near zero or the detection limit of the instrument) to begin with, the drying can push the result into negative territory. Data management and quality assurance are key to sound data reliability, so understanding the detection limit of the instrument and frequent calibration are critical pieces of this data management plan.
Carrie, we are smelling smoke from a wood burning stove in the area when we are seeing some spikes of PM2.5. Could this be detected on our monitors?
Absolutely! As we transition into fall, there are a few things we can expect to smell. . . pumpkin spice, a mix of crisp leaves and apple cinnamon, and wood smoke. Even with increasing electrification and natural gas infrastructure, wood burning remains a fixture in many American homes. With the rising electric costs and other heating fuel costs, families still use wood as a primary or secondary heat source. And while air pollution standards have been tightened across industries in America, woodsmoke was largely unregulated until 2015 when EPA instituted New Source Performance Standards for new wood heaters. However, these standards do not apply to wood heaters/stoves that were already in use in homes prior to 2015. These wood heaters/stoves can have negative health issues, and some areas are beginning to tackle woodsmoke as an environmental justice issue by tracking its disproportionate impact on disadvantaged, marginalized, and low-income communities.
Burning wood may smell good, but it releases a host of particles and gases including PM2.5, carbon monoxide, nitrogen oxides and other volatile organic compounds (depending on what is being burned). Cordwood, the wood that people chop themselves, or buy in bundles, releases more smoke, especially when it is damp. Wood stoves and fireplaces release smoke through chimneys and vents and contribute significantly to ambient air pollution. Did you know that one old, inefficient wood stove can pollute as much as 15 old diesel dump trucks?1 A gust of wind past a nearby chimney, carrying that smell of smoke onto our location, is also carrying PM2.5, which is detected on our monitors. If you can smell the smoke, the PM2.5 is there.
Thanks for the keen observations as we continue to expand our Radical Transparency efforts. Keep your questions coming!
1 EPA August 2022
Related Articles...