Real-Time Data, Real Results
Address to the 2025 Penn State Climate Solutions Symposium
May 21, 2025

The following is a summary of CNX’s Chuck Hardoby’s remarks from the 2025 Penn State Climate Solutions Symposium. Hardoby, CNX’s VP and Controller of Regulatory Reporting, discussed CNX’s Radical Transparency initiative as part of the symposium’s “What Are the Health and Climate Costs and Benefits of Natural Gas Production?” session.
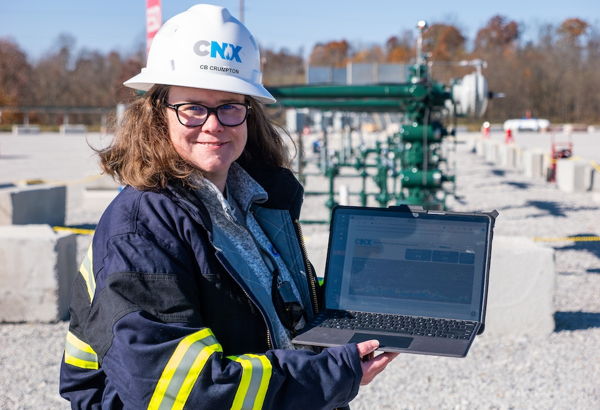
I’m here today to talk about the CNX Resources Radical Transparency program. The program is designed to inform the communities surrounding our operations with objective facts about health risks related to natural gas development. It’s our contribution to improve upon the ever-expanding body of epidemiological research being conducted in this area.
For background, CNX is one of the leading natural gas producers in the nation. Our operations are centered around the prolific Marcellus and Utica shales that lie within the Appalachian region, an area the company has called home since the mid-1800s.
We launched Radical Transparency in 2023. The idea was simple: provide real-time, on-site data through a transparently controlled process. Doing so would provide the superior platform to determine whether there are, in fact, any adverse health-causing emissions coming from our operations—better than the epidemiological approach, which addresses causation by inference through historical statistical association.
Our publicly available data is continuous and objective, with independent collection by an accredited third party. It can be used by local residents, provide actionable insights for industry, support scientific and medical studies, and guide public policy.
We went to the Pennsylvania DEP and Governor Shapiro with our idea. And as testament to its logical approach and compelling benefits, they supported the effort, became crucial partners in RT, and can now utilize the fact-based results from RT monitoring to inform future policy.
When setting critical policy and seeking truth, transparently reported real-time on-site data is always superior to statistical associations and inference. It’s not just a better way; it is the best way.
Program Components
The specific components of the Radical Transparency program are the most comprehensive in the country and can be categorized into air quality monitoring, additive disclosure, water quality monitoring, and radiation protection.
Given the limited time for today’s presentation, I will focus on highlighting some details of the air quality portion of our program. It is the centerpiece and most complex component, specifically designed to monitor the most likely operational air emissions that could cause negative health effects.
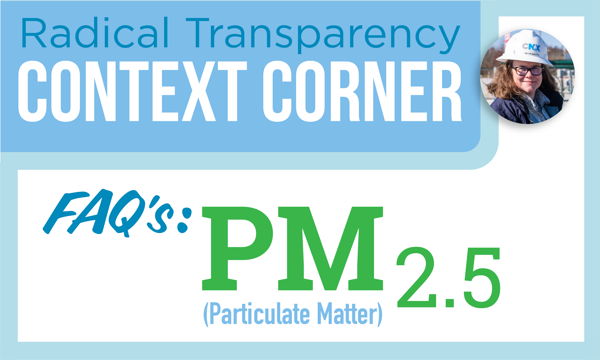
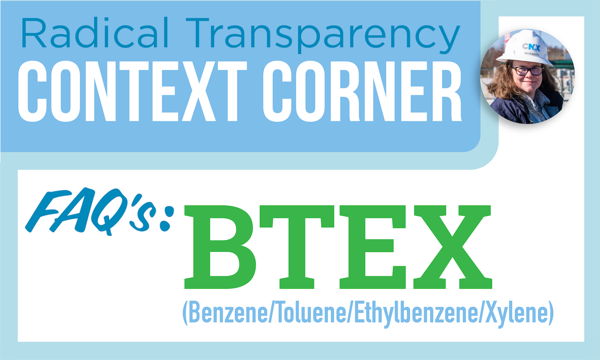
The specific criteria pollutants selected for monitoring are particulates with an aerodynamic diameter of less than 2.5 microns, more commonly known as “PM2.5,” and the compounds benzene, toluene, ethylbenzene, and xylenes, referred collectively as “BTEX.”
Air Quality Monitoring Process
First, let’s talk about site selection. RT monitoring follows the company’s activity plan. Where we go, RT goes with us. It’s during this development process of site construction, drilling, completions, and start of flowing production where our activities are most intense and the most logical application for continuous, and targeted monitoring.
To avoid any subjectivity in the site selection process, we continuously monitor all major midstream locations and every new major production facility from the beginning of construction through six months of production.
This approach ensures that we prospectively monitor 100% of our locations with development phases that have the highest intensity of emissions related activity.
To ensure that the measured monitoring data is of the highest quality—representative, complete, and reliable— monitoring and reporting are conducted by an independent accredited third party in accordance with guidelines approved by the United States EPA and within a defined quality system framework.
For the monitoring of PM2.5, we install and operate two real-time beta attenuation mass monitors at the perimeter, or fenceline, of each site. These monitors have been designated by the EPA as a Class III automated federal equivalent method.
For each site, one monitor is installed in the downwind direction of the prevailing winds, designed to capture impacts from the ongoing natural gas activity. The second monitor is located opposite to the first, in the upwind direction, and takes measurements that represent local background levels. Calculating the difference between the two establishes the incremental contribution from the site.
In addition to PM2.5, we also perform measurements of local BTEX concentrations around each selected site. The BTEX measurements are conducted using a passive time-integrated sampling approach guided by EPA Method 325. Four stand-alone samplers are placed in each quadrant surrounding the site, two of which occupy the same upwind and downwind locations as the PM2.5 monitors. Samples from the monitors are collected and sent for analysis to an accredited laboratory, per EPA Method 325B.
Data Collection and Transparency
Once collected, all data is transmitted to a secure, cloud-based environmental management platform for reporting, storage, and visualization.
We make all data collected from the RT program available to the public by posting the monitoring results to a dashboard on the CNX website. For context, we display our readings alongside those from nearby regional Pennsylvania DEP monitors, as well as established health-based standards. For PM2.5, we show the National Ambient Air Quality Standard, and for the BTEX compounds, we compare those with the US ATSDR inhalation Minimum Risk Levels.
To support integrity and reliability, the data are also delivered directly from the accredited third-party collector to the Pennsylvania DEP.
Key Findings and Why it Matters
Now, approaching two years into the effort, we have conducted monitoring at 18 sites, with over 400,000 data points collected and made publicly available. Preliminary analyses of the data have led to the following findings:
- Site contribution analysis shows evidence of low-frequency fugitive emissions from drilling and completions operations.
- Background level concentrations of BTEX were observed at the fenceline of all facilities monitored, and no exceedances of US ATSDR Inhalation Minimum Risk Levels were observed.
- No exceedances of the US EPA PM2.5 NAAQS were observed.
In other words, these data show no indications of emission levels that exacerbate asthma, cause cancer, or degrade local air quality. And we believe that as we continue to expand the scope and footprint of RT, these conclusions will be reinforced with more corroborating data.
The hundreds of thousands of data points will soon turn into millions as we continue to monitor and collect data by the hour, 365 days per year.
Continuing the Journey
We’ve been calling on others in the industry to follow our lead and help us grow the data set even further. We also call on the scientific community to recognize the benefits and superiority of real-time measured data. There is also a need for stringent analysis and reconciliation to the existing statistical record that universities have a duty to provide. We ask that you join us in this pursuit of truth and help us inform the public. We are willing to listen to your suggestions on how we can improve.
From a policy perspective, future regulations can now rely on actual, directly measured data and follow what the data tell us.
The RT journey has been challenging, but it has made CNX better and lowered our risk footprint and emission profile. We think RT has—and will continue to—benefit all stakeholders, most importantly the communities and environment where we operate.
Visit https://climate.psu.edu/what-we-do/climate-solutions-symposium/ to learn more about the 2025 Climate Solutions Symposium.
You may also like...