
Radical Transparency Independent Analysis Highlighted at 2025 AWMA
CleanAir Engineering recently presented to a National Scientific Audience at the 2025 Air and Waste Management Association (AWMA) Air Quality Measurement Conference
June 2, 2025
By Dr. Doug Goetz, Program Manager at CleanAir Engineering
Starting in October 2023, CNX’s Radical Transparency Air Quality monitoring program has collected more than 10 years’ worth of continuous monitoring data from their natural gas development and midstream sites within the Appalachian Basin. The scale of monitoring rivals the air quality programs of large cities and has provided unique public access to data that can be used to unravel public health concerns associated with shale gas operations. The map below shows the location of the 18 sites monitoring air quality as part of the CNX’s Radical Transparency effort.

The focus of the monitoring is to measure the concentration of the air pollutants known as PM2.5 and BTEX at the fenceline of the site or as close to 500 feet from the center of the site as Appalachian topography allows. PM2.5, or particulate matter less than 2.5 µm in diameter, is considered a criteria air pollutant and regulated by the U.S. Environmental Protection Agency (EPA) with National Ambient Air Quality Standards (NAAQS). BTEX, the acronym for the volatile organic chemicals benzene, toluene, ethylbenzene, and xylene, are defined as hazardous air pollutants (HAPs) under the U.S. 1990 Clean Air Act Amendments. These pollutants were chosen because of their known health risks and because they are proxies for emissions sources thought to be common to shale gas development.
Fenceline monitoring can serve as an indicator of the air pollution concentrations that nearby communities could be exposed to, and those measured concentrations can be compared to established standards to inform on likely health risks. Upwind and downwind continuous monitoring, like what is being conducted at the Radical Transparency sites, combined with real-time wind observations, can be used to estimate the concentration enhancement of pollution downwind of the site. In other words, the large dataset aggregated from the 18 total monitoring locations can be analyzed and used to inform the scientific, health, and policy communities about the air quality impacts downwind of natural gas operations.
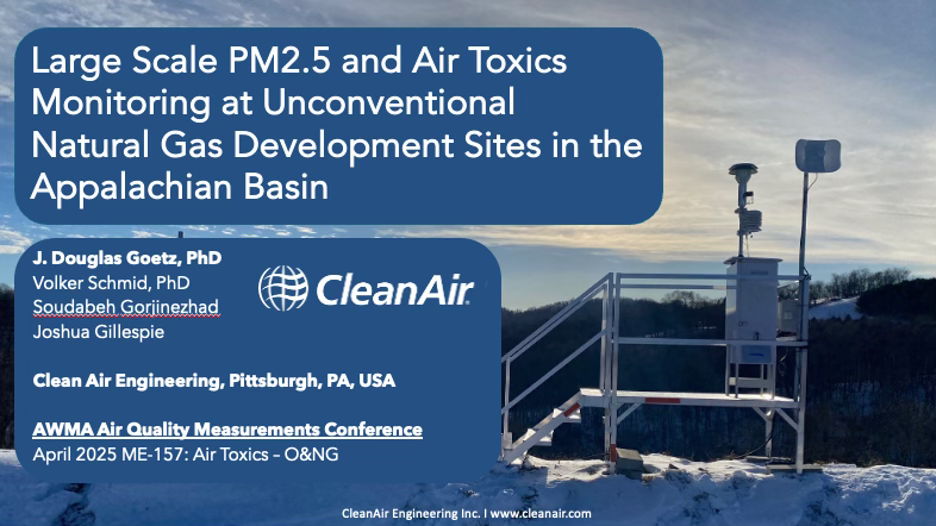
In April 2025, I presented a preliminary analysis of the aggregated monitoring results at the Air and Waste Management Association (AWMA) Air Quality Monitoring Conference hosted in Denver, CO. The conference brings together air quality scientists, health risk experts, and state, local, and federal environmental agency personnel. My oral presentation was part of the Air Toxics – Oil and Natural Gas session and was accompanied by similar talks about fenceline air quality monitoring in other U.S. shale gas plays. The presentation was well received by the community, and many in the audience were excited to see results from the Appalachian Basin.
For the presentation, my CleanAir colleagues and I adapted two methods for analysis from examples found in scientific literature. First, we developed a simple algorithm to conduct a real-time wind-resolved estimation of the enhancement concentration (∆C) of PM2.5 based on upwind and downwind measurements. In plainer terms, the developed method allows us to estimate which monitor observes air entering the site (i.e. background concentration) and which monitor observes the air leaving the site (i.e. background concentration + site emissions). In turn, this forms the basis for calculating hourly ∆C concentrations.

The second analysis method was to estimate the ∆C observed at public monitoring locations to provide context for how the fenceline ∆C measured as part of the Radical Transparency monitoring program compares to other locations in Pennsylvania. These comparisons included a near-highway location and a rural background station. The method needs some fine-tuning but draws from publications like my peer-reviewed work in 2017 that characterized local background concentrations of methane and air pollutants in the Appalachian basin.
The results from the aggregated data analysis show several key takeaways:
- BTEX concentrations at all facilities were observed to be near regional background concentrations and below established non-cancer inhalation minimum risk levels for acute and chronic exposure based on the U.S. ATSDR toxicological guides.
- Toluene-to-benzene concentration ratios can be used to evaluate emission sources at each site.
- A case study from the Morris compressor station shows that mobile sources like cars and trucks are likely a primary source of emissions at the facility.
- No exceedances of the PM2.5 NAAQS (24-hour average of 35 µg/m3) were observed at any of the 18 monitoring locations
- Wind-resolved PM2.5 ∆C analysis indicates that there are emission events from all phases of the monitored natural gas activity, but these events are low in frequency. Additionally, activities like drilling and completions show the highest frequency of emission events, but the activities are short-lived (i.e. <6 months).
Please take a look at the presentation slides for more detailed results:
GOETZ_AWMA_Measurements_2025_V1_Verbose.pdf
PDF - 2.9 Mb

Opportunities like the AWMA Air Quality Measurements Conference are invaluable as a tool to discuss ideas and results amongst technical experts. The conference presentation also serves as a good preview of what is to come. We at CleanAir look forward to continued access to the ongoing monitoring data and are excited to further develop our analysis methods. Stay tuned for news about the submission of this research to a peer-reviewed journal in the coming months.
You may also like...


