Context Corner Edition 5 – Data is in! What is it saying?
A Summary from MOR9 Drilling Operations
February 8, 2024

By Carrie Crumpton, CNX Vice President of Environmental Strategy
CNX recently completed the horizontal drilling phase of four wells at the MOR9 pad in Greene County, PA. As we shift our monitoring focus over to the hydraulic stimulation phase on this pad, people want to understand how to put the data into context.
Hey, Carrie, what did we see as a result of our monitoring activity during drilling? Is it what we expected?
First, I think we need to talk a little about our expectations. Due to the nature of drilling and the activity on pad, I believe we did expect to see some occasional downwind contribution of PM2.5 simply because four diesel powered generators (nearly 7500 horsepower) were running to power the rig and ancillary equipment. Drilling activity also relies on logistical support provided by diesel truck traffic for equipment deliveries, drill cuttings removal, and cement deliveries (which provides the cement necessary to install/secure the protective casing in the well bore).
While we haven’t taken the step to perform confirmatory analysis of where the particulate matter (PM) originated, we do see indicators that these activities coincided with and may have contributed to what we observed on the monitors, and that aligns with our expectations.
While we have truck traffic on site during drilling operations, it is interesting to note that during the height of our activity, which is typically during cementing activity, a drilling pad can see around 15 highway trucks during a 24-hour period. These trucks are making cement and other deliveries and hauling away cuttings. This peak horizontal drilling activity occurred for about 8 days at MOR9 spread over the two-month horizontal drilling window. Consider this pad activity in the context, for example, of the number of school buses that drive through the parking lots where children go to school each day – one Washington County school district has 34 buses (or similar transport vehicles) that run daily, twice a day, totaling 68 vehicles driving through the parking lot during a 24-hour period, 180 days, every year. This begs the question, what is the impact of these emissions on local air quality and local resident health? Is there a focus on transparently monitoring, measuring, and reducing these emissions? If not, we believe there should be and CNX has provided a template not just for the natural gas industry, but for any activity that produces emissions and has the potential to impact community health and wellness.
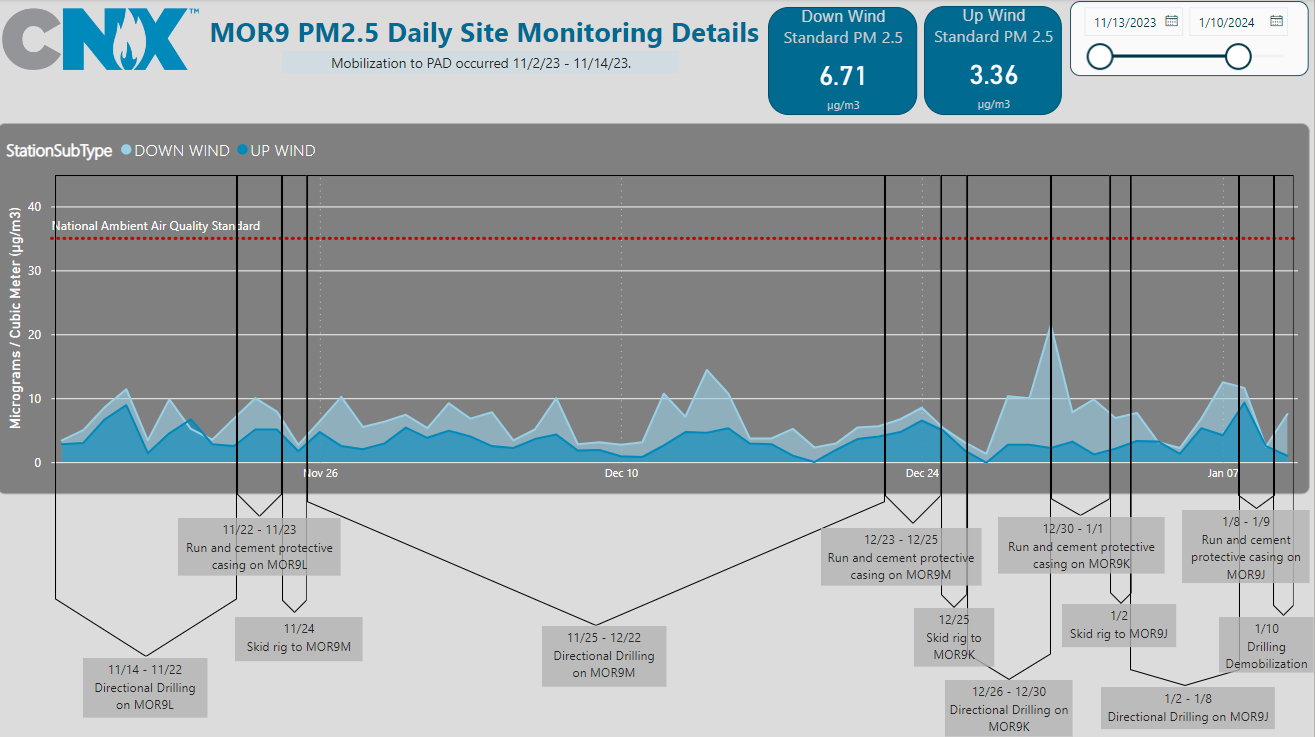
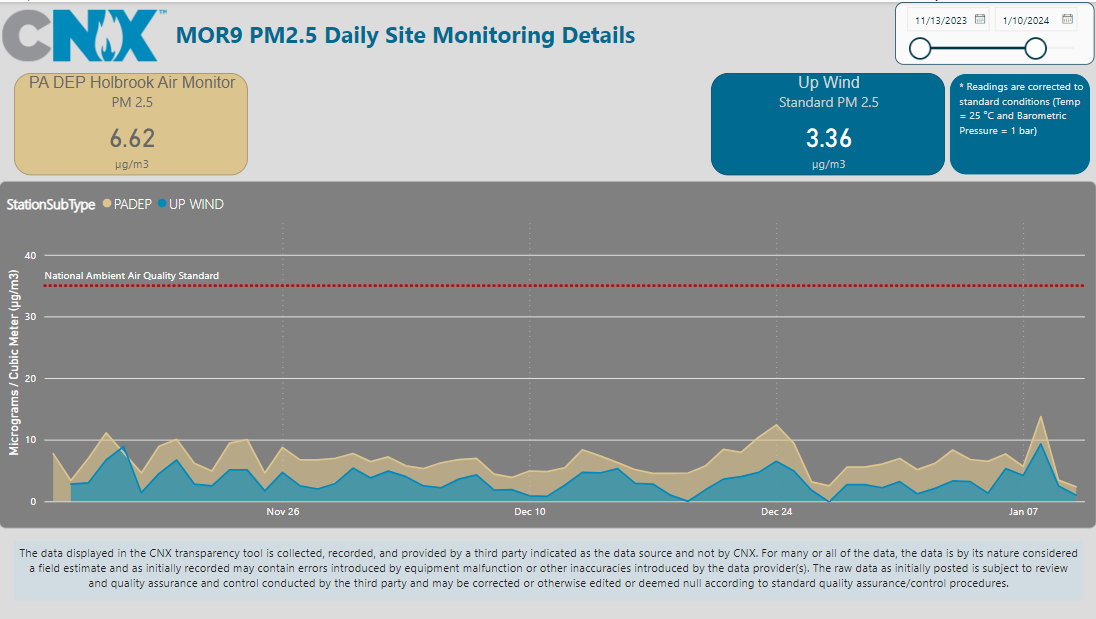
What we can also confirm is that during the monitoring period of the horizontal rig from November 14, 2023, until demobilization of the equipment around January 10, 2024, PM2.5 24-hour averages were well below the National Ambient Air Quality Standard of 35 micrograms/cubic meter (µg/m3) (24-hour standard). The downwind average for the period of time covering horizontal drilling operations (6.71 µg/m3) shows there is better air quality, in terms of PM2.5, on this pad than there generally is in Allegheny County, which had a 2022 PM2.5 Level (Annual Average) of 8.52 µg/m3, as published in Clearing the Air 4.01, a report that focuses on the region’s air quality improvements since 2000 and how this region compares to other metropolitan areas. Note that these averages are below the USEPA Annual Average PM2.5 Standard of 12.0 µg/m3. Additionally, the average differential between our upwind monitor and our downwind monitor that we observed is just over 3 µg/m3. We are providing these preliminary observations as we continue to analyze and learn from the detailed data that we collected. Even though we are below any regulatory standards, we are committed to continuous improvement and we are correlating the readings with our operational activities so we can do just that.
We also noted (as displayed in the graph below) that the upwind monitor trends generally aligned with the PADEP monitor at Holbrook, which we utilized for the regional background, lending to confidence in our data and approach.
CNX will continue to analyze the data to identify improvement opportunities; and provide additional analysis of the data as our program matures.
1Clearing the Air 4.0, 2022 Data, Air Quality Analysis November 2023, Pittsburgh Works Together
Related Articles