
Crunching the Numbers: Energy Source Externality Accounting
CNX's Nick Deiuliis examines externality costs.
February 8, 2023

CNX Resources President and CEO Nick Deiuliis offers commentary following an inquiry from an academic team conducting research on externality costs. The inquiry asked to identify peer companies that either externalize the smallest or largest proportion of their costs. Externalities were defined as, “costs incurred by third parties, such as local communities, due to a company’s business operations that are not borne by the company itself.”
In his response to the inquiry, Nick suggests externality accounting is first performed across different sources of energy and power generation prior to assessing peers or competitors within a specific type of energy. Nick subsequently compares the externality costs between the natural gas industry versus the wind and solar industries.
Properly Sequencing Externality Accounting
Externality accounting is a useful tool when applied objectively, but one that is often misapplied and mishandled by those looking to dial in desired outcomes. Many fail to appreciate the sequencing of externality screening is crucially important when assessing entities across the energy industry.
Before assessing peers or competitors within a specific type of energy (such as natural gas), one should first apply externality accounting across the different sources of energy and power generation.
Thus, I propose a context of peer/competitor that is a level higher than, and a precursor to, what you proposed in your request.
The first cut of externalities should be done on an energy source-versus-energy source basis. In other words, domestic natural gas compared to wind or solar energy sources.
Society must screen options of energy sources within the wider portfolio first, and then set policy and investments to reflect the math of the externality accounting. First figure out the best energy source, as dictated by externality accounting.
After the first cut, or filtering, by energy source, one can then turn attention to different players within individual energy sources.
Getting the externality accounting/ranking for discrete energy sources (natural gas versus wind or solar) right is much more important than, and is a prerequisite to, screening or ranking individual players within an energy source (CNX Resources versus our natural gas competitors).
Many, including those in academia and government, have failed miserably to perform the rudimentary externality accounting and ranking of different energy sources. That leads to wrong-headed energy and climate policies resulting in dire consequences seen everywhere these days. Conditions will only worsen until this failure is corrected.
So, for the purpose of your inquiry and the discussion that follows, I am the natural gas industry, not just a player within it. And my peers/competition are the wind and solar industries, not another peer in the natural gas industry.
CNX Resources
CNX Resources is not a typical public energy company. We occupy a unique space in both the industry and region we call home.
We are nearly 160 years old – Abe Lincoln was president when we were incorporated. We manufacture natural gas in the northern Appalachian basin (PA/OH/WV/VA). The Appalachian basin “accounts for nearly one-third of all U.S. dry natural gas production,”1 and looks to be the second largest natural gas field on the planet. We operate in the Marcellus and Utica shales, we collect coal mine methane, and we operate midstream pipeline and processing infrastructure.
At CNX, our sustainable business model is simple: Tangible, Impactful, and Local. We’ve embraced the role as a regional innovator driving Appalachia’s socio-economic revitalization through local talent, homegrown energy, and breakthrough technologies.
We don’t apologize for what we do for society, we proudly celebrate it.
If our industry were to disappear tomorrow, society would come to a complete halt and humans across the planet would suffer greatly. That might not be what the experts or the environmental movement warrant, but that is certainly the engineering reality.
CNX recently unveiled its Appalachia First vision, which lays out many of the key themes I discuss below. Please learn more about our vision at www.positiveenergyhub.com. The site includes an approximately 45-minute presentation where I further discuss Appalachia First, which can be best summed up as “produce it here, use it here, first.” I think you will appreciate some of the policy positions.
Natural Gas
There are a few, crucial scientific and engineering realities that are often ignored when assessing the externalities of domestic natural gas.
Natural gas is the most cost-effective form of energy in the United States, providing consumers, businesses, and homeowners savings in energy costs that total in the hundreds of billions of dollars annually. Rampant inflation has caught everyone’s attention these days; the most effective means to curtail general inflation is to simply allow natural gas to provide cheap energy so that energy inflation, and by extension general inflation, is mitigated.
Natural gas is the superior solution to immediate and material greenhouse gas emission reductions. Domestic natural gas has and can continue delivering these benefits while maintaining power grid reliability during the dark days of winter and dog days of summer.
Power grid reliability cannot be underscored enough. From college campuses to homes, and from hospitals to emergency responders, and from government buildings to other businesses and facilities, America needs power all day and night, 24/7, 365 days/year.
Environmental Benefits of Natural Gas
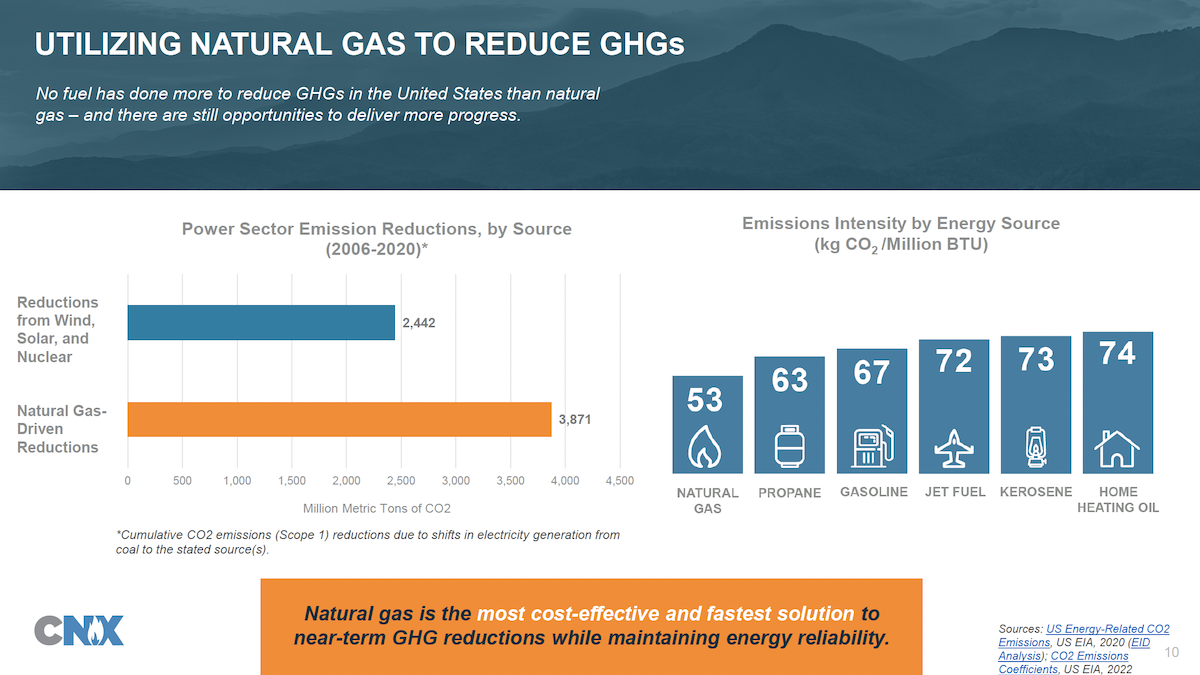
Today, much attention is focused on methane emissions. Natural gas produced in Appalachia has the lowest methane intensity (0.09%) of all major U.S. oil and natural gas producing basins, according to Clean Air Task Force data.2 Additionally, Rystad Energy analysis of CO2 intensity performance “brings Appalachia to the top quartile among all oil and gas fields globally” with the firm expecting the basin to “improve further in its CO2 intensity dimension in the next three to four years.”3
When natural gas competes with alternative energy sources in a free market, emissions drop, and environmental quality improves. As natural gas-fired electric generation topped 40% of the total grid, power sector emissions dropped by nearly the same, per the U.S. EPA. “The decrease in coal-powered electricity generation and increase in natural gas and renewable energy electricity generation contributed to a decoupling of emissions trends from electric power generation trends over the recent time series,” the agency wrote in its April 2022 inventory.4
Consider the specific example of the PJM power grid. Power sector emissions declined 11% year-over-year as natural gas grew to 44% of PJM’s total capacity. And, Pennsylvania had the highest absolute decline of energy-related CO2 emissions of any state between 1990 and 2018, with emissions falling as natural gas became the state’s largest electricity source. The data and facts are unequivocal, yet rarely heard.
Economic Benefits of Natural Gas
The environmental gains tied to natural gas come with additional economic and job creation benefits.
Natural gas development across Appalachia has breathed new life into forgotten Rust Belt communities and brought the building trades and apprentice programs to full employment.
Careers paying family-sustaining wages offer on-ramps to the middle class for young adults in urban and rural communities who are not able or wanting to attend college. Manufacturing, which relies on reliable and cheap energy inputs, is experiencing a resurgence across Appalachia and the Midwest, creating a downstream benefit to the natural gas industry. These create huge, positive externalities.
Investment and growth in the natural gas industry grows tax base for governments and communities. Today governments are desperate for sustainable endeavors and economic sectors that pay their fair share of tax. You won’t find another industry in Appalachia that pays more of a fair share of tax than the natural gas industry.
And natural gas is the catalyst that accelerates and de-risks the integration of next-generation technologies, such as hydrogen, into our economy. That creates optionality for innovation, a serious and positive contributor to the externality math.
Bottom line: there’s never been a better climate jobs program than the shale gas revolution. Performing an objective and clinical externality accounting would prove it.
Intermittent Wind and Solar Energy Sources
Now, let’s discuss the externalities of wind and solar.
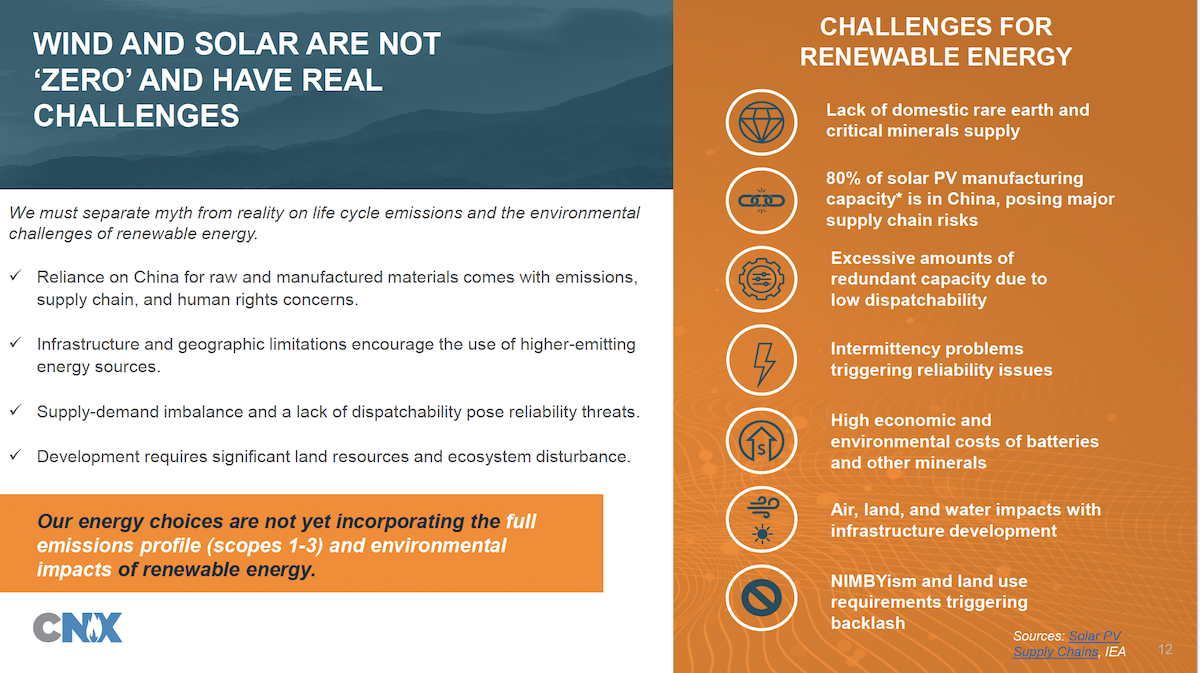
The most fundamental misunderstanding about wind and solar is the myth that they present a zero carbon footprint. That is simply not true, not by a long shot.
Carbon footprint must be assessed on a life cycle, scopes 1-3, basis. It doesn’t matter to the atmosphere where the CO2 is emitted in the life cycle of making and running a wind turbine or solar panel; just because there is not a significant emission once in place does not mean there is a zero carbon footprint.
To accurately account for the carbon footprints of wind and solar, the supply chain of how wind and solar power ‘happen’ must be traced:
- First, massive environmentally destructive mining must occur in Russia, China, and Africa for the metals and materials comprising wind turbines and solar panels. That presents a huge carbon footprint and large CO2 emissions.
- The raw mining products must be processed to purify them, which also requires huge inputs of carbon power and the associated CO2 emissions.
- Then components need manufactured in factories, often in China, that are carbon-powered.5
- Manufactured components are then shipped thousands of miles on carbon-fueled planes, trains, ships, and trucks to arrive in places like America.
- Trees and land must be cleared to site pads and concrete will be used to build the pads for the turbines and panels, emitting more carbon dioxide.
- New transmission lines must be run to every wind turbine and solar panel block/array, requiring the felling of more trees to create the rights-of-way and the manufacturing of the new power lines, adding to the CO2 emission tally.
- Backup and reliable sources of generation will be required for when the sun isn’t shining or the wind isn’t blowing, which will typically be carbon-based power generation (often coal) creating more carbon dioxide emissions.
- There is no such thing as a wind- and solar-only grid, because both sources of electricity are intermittent (battery storage cannot be scaled to serve as backup and it has a carbon footprint worse than wind and solar).
- It’s also worth noting the double-building and maintenance of power generation units increases costs to consumers.
- In seven to 10 years, you need to perform this process all over again, because the turbines become obsolete and must be scrapped (there is no way to recycle wind turbine blades) and solar panel efficiency declines year after year. The repeat of the cycle doubles the carbon footprint.
There is also the impact on surface land that wind and solar have to add to the externality analysis. For a 100% wind- and solar-powered U.S. grid, wind and solar farms would have to occupy 300 million additional acres of land beyond what’s used to power our economy today. That’s building solar and wind farms across land areas equivalent to Arkansas, Iowa, Kansas, Missouri, Nebraska, and Oklahoma, according to Bloomberg analysis of Princeton data.6 A ridiculous non-starter of course, yet no one seems to acknowledge it as such.
Negative externalities exist with the aforementioned disposal of turbines and panels beyond their useful lives. Wind turbines can’t be recycled and are “piling up” in landfills, according to Bloomberg.7 Solar panels contain hazardous materials which must be disposed of properly or risk environmental damage; most environmentalists would consider it hazardous waste (until you told them it was from solar).
Today, consumers want their eggs to come from cage free chickens, their tuna to be caught with dolphin friendly nets, their straws to be biodegradable, their detergents to not use chemicals harmful to water ecosystems, and their jewelry to have gems that are conflict-free.
Yet there is not a home in America today with rooftop solar that can say with certainty those panels were not partially manufactured by either child- or slave-labor. The human rights abuses tied to the murky global supply chains of wind and solar are egregious. Yesterday we were concerned about blood diamonds; today the concern should be about blood solar. The externality cost of human rights abuses in the manufacturing of wind and solar is sobering.
And there is no wind turbine in America today that can warrant it does not kill scores of birds and bats, many of them endangered. Offshore wind farms near New York and New Jersey are being constructed in the middle of endangered whale habitat, and, wouldn’t you know it, but dead whales are now washing up on beaches in New Jersey and New York. Yesterday we were worried about saving the whales and the bald eagle; today the worry should be how wind turbines lay waste to whales and eagles. Energy production that proves deadly to sensitive species and habitats should be reflected in an externality analysis.
Wind and solar require tax subsidy that exceeds total subsidy of natural gas, coal, or oil by orders of magnitude. When you add up the various programs and subsidies to favor wind and solar, the tally will register in the hundreds of billions of dollars (or perhaps even in the trillions of dollars), depending on what time frame you choose. Those valuable dollars could be invested elsewhere and should be added as an externality cost.
There are serious geopolitical externality costs tied to wind and solar. China’s control of the solar panel supply chain has ballooned to 84% over the past decade, with the country also controlling the bulk of critical minerals production and processing necessary for battery storage. This is a critical risk that presents energy security, supply chain, and national security concerns that manifest as negative externalities.
Wind and solar aren’t keeping pace with global energy demand, falling 165 exajoules short of needed capacity, according to the 2022 BP Statistical Review of World Energy.1 Growing global energy demand requires massive scale that cannot be met with wind and solar under the laws of physics.
When wind and solar inevitably fail to deliver at scale due to their engineering realities, energy security in places like Europe necessarily falls back to carbon-based fuels from places like Russia. That emboldens despots to use the gifted energy leverage to warmonger, as in the case of Ukraine. Climate policies and the resulting flawed reliance on wind and solar are the root causes of the war in Ukraine. The policies created a de facto EU reliance on Russian energy. What’s the externality cost of Russia in the Ukraine? Whatever it is, add it to the negative externality tally for wind and solar.
Add it Up
Tabulating the externality impacts of energy provided through natural gas and comparing it to those for wind and solar will present a trio of decisive and obvious conclusions:
- All economic activity and forms of energy have carbon footprints; there is no such thing as truly zero carbon power or a zero carbon economy.
- Natural gas offers the best net externality balance within an energy portfolio. Its externality benefits are substantial and diverse while its externality costs are modest.
- Wind and solar present a massively negative net externality cost to society, particularly when the attempt is to deploy them at scale.
These three conclusions are opposite of what is warranted by the environmental movement, and many in government and academia. Climate and energy policies are set that ignore the math. We share a duty to correct that.
References
1 U.S. natural gas production set a new record in 2021 https://www.eia.gov/todayinenergy/detail.php?id=54200
2 Benchmarking Methane and Other GHG Emissions of Oil & Natural Gas Production in the United States https://www.catf.us/resource/benchmarking-methane-emissions/
3 “International analysis finds Marcellus best in carbon dioxide intensity” https://www.bizjournals.com/pittsburgh/news/2021/04/23/rystad-energy-international-analysis.html
4 Inventory of U.S. Greenhouse Gas Emissions and Sinks: 1990-2020 https://www.epa.gov/system/files/documents/2022-04/us-ghg-inventory-1990-2020-data-highlights.pdf
5 China’s Greenhouse Gas Emissions Exceed Those of All Other Developed Countries Combined https://www.scientificamerican.com/article/chinas-greenhouse-gas-emissions-exceed-those-of-all-other-developed-countries-combined/
6 Net-Zero America: Potential Pathways, Infrastructure, and Impacts https://netzeroamerica.princeton.edu/the-report
7 Wind Turbine Blades Can’t Be Recycled, So They’re Piling Up in Landfills https://www.bloomberg.com/news/features/2020-02-05/wind-turbine-blades-can-t-be-recycled-so-they-re-piling-up-in-landfills#xj4y7vzkg
8Statistical Review of World Energy. https://www.bp.com/en/global/corporate/energy-economics/statistical-review-of-world-energy.html